RadExPro is seismic processing software for Windows, providing a comprehensive suite of capabilities. From real-time seismic acquisition quality control (QC) and in-field processing to the creation of final stacks, RadExPro simplifies every step of seismic data processing.
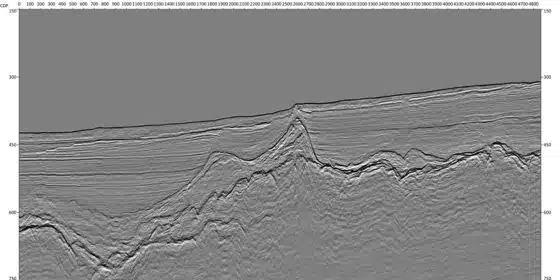
Many of our clients rely on RadExPro for comprehensive HR/UHR marine seismic processing, encompassing both 2D and 3D data, benefiting from a suite of dedicated seismic processing algorithms fine-tuned to address typical challenges associated with this type of data. These include efficient adaptive deghosting, powerful multiple suppression, precise high-resolution marine statics, advanced 3D regularization, and pre-stack migration.
The Vertical Seismic Profile (VSP) processing facility within RadExPro offers extended support for Distributed Acoustic Sensing (DAS) data. It seamlessly handles data formats from all major manufacturers of DAS equipment, providing real-time in-field QC and data analysis, as well as conventional VSP processing.
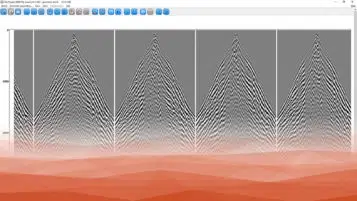
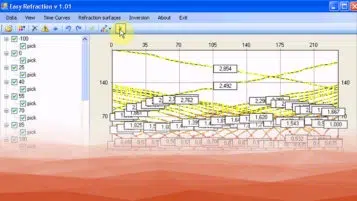
RadExPro isn’t limited to marine applications. It’s your trusted companion for complete near-surface land seismic data processing, including seismic reflection, refraction, and Multichannel Analysis of Surface Waves (MASW).
With a development legacy dating back to 1992, RadExPro is trusted by hundreds of geophysical and geotechnical companies, esteemed universities, and renowned research institutes. With a global presence, RadExPro serves clients in more than 50 countries worldwide.