Near–Surface Seismic Processing/Reflection
RadExPro is perfectly capable for in–depth processing of on–land near–surface reflection data.
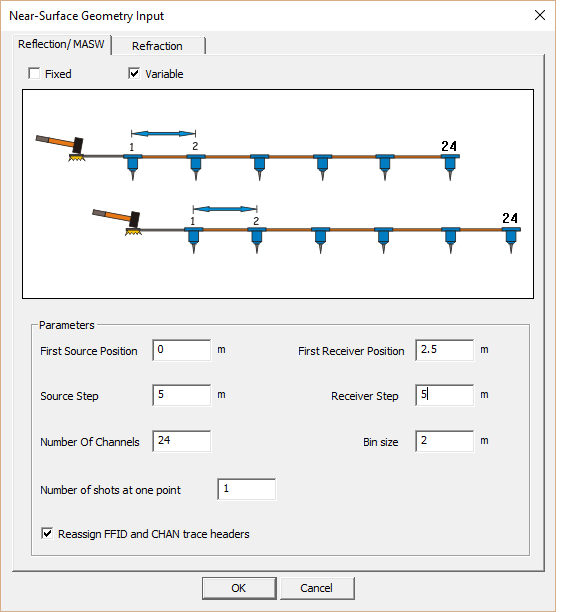
- Intuitive geometry assignment tool for most standard linear 2D acquisition scenarios
- Loading geometry from ASCII tables and SPS–files for more complicated cases
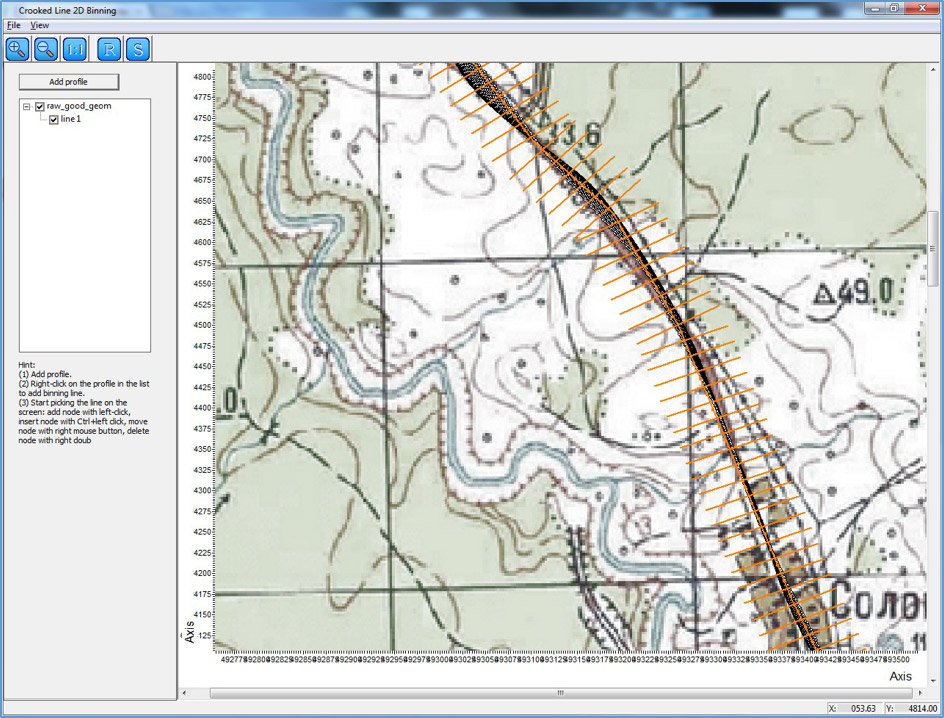
- Crooked–line 2D CMP binning
- Both impulsive and vibroseis data processing
- Near–surface 3D seismic data processing
- Multicomponent data processing
- Exhaustive set of signal processing algorithms and 2D filters
- Interactive velocity analysis
- Pre–stack and post–stack Kirchhoff migration
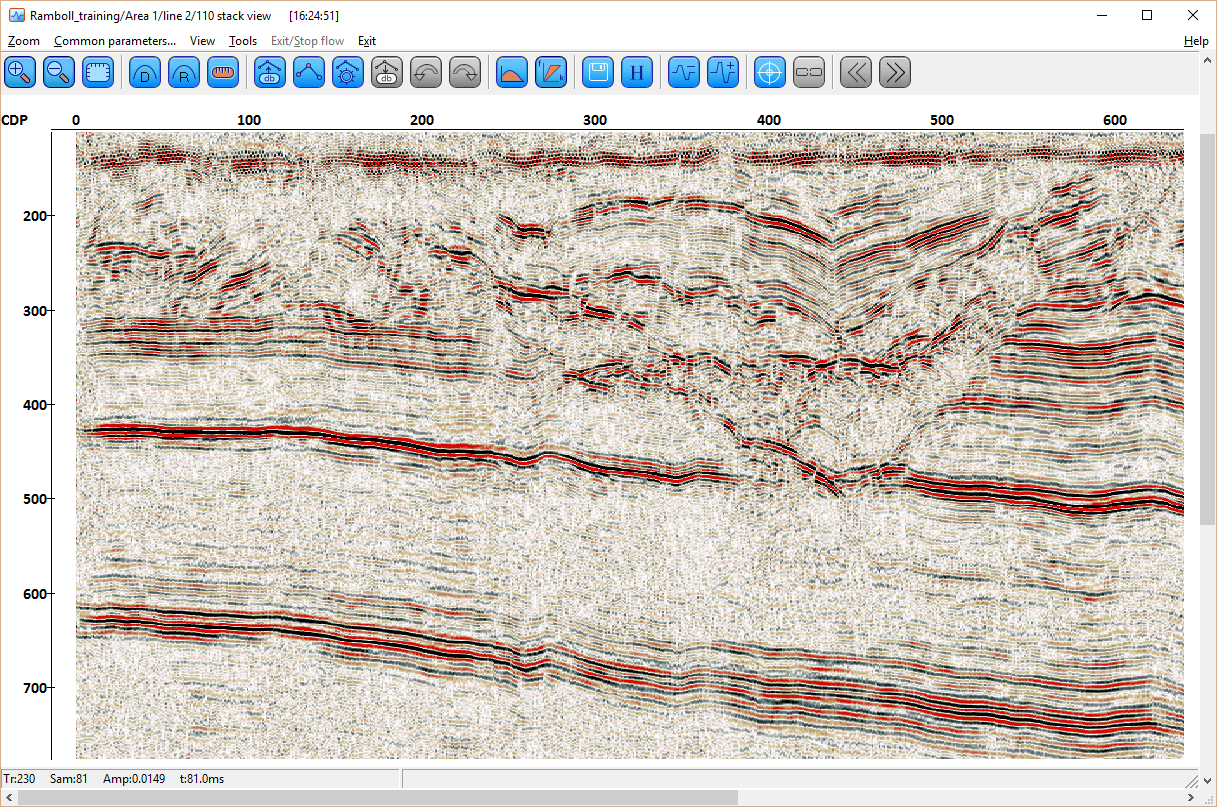
Data courtesy of Ramboll. Acquired in the southern part of Denmark.